Note
Click here to download the full example code
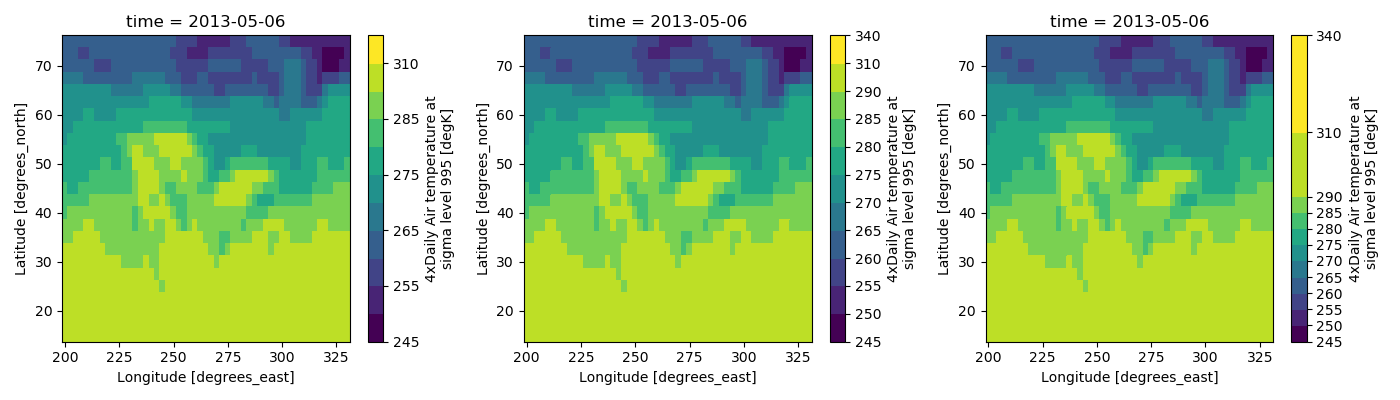
Control the plot’s colorbar
Use cbar_kwargs keyword to specify the number of ticks.
The spacing kwarg can be used to draw proportional ticks.
import matplotlib.pyplot as plt

import xarray as xr

# Load the data
air_temp = xr.tutorial.load_dataset("air_temperature")
air2d = air_temp.air.isel(time=500)

# Prepare the figure
f, (ax1, ax2, ax3) = plt.subplots(1, 3, figsize=(14, 4))

# Irregular levels to illustrate the use of a proportional colorbar
levels = [245, 250, 255, 260, 265, 270, 275, 280, 285, 290, 310, 340]

# Plot data
air2d.plot(ax=ax1, levels=levels)
air2d.plot(ax=ax2, levels=levels, cbar_kwargs={"ticks": levels})
air2d.plot(
    ax=ax3, levels=levels, cbar_kwargs={"ticks": levels, "spacing": "proportional"}
)

# Show plots
plt.tight_layout()
plt.show()
Total running time of the script: ( 0 minutes 1.766 seconds)