Note
Click here to download the full example code
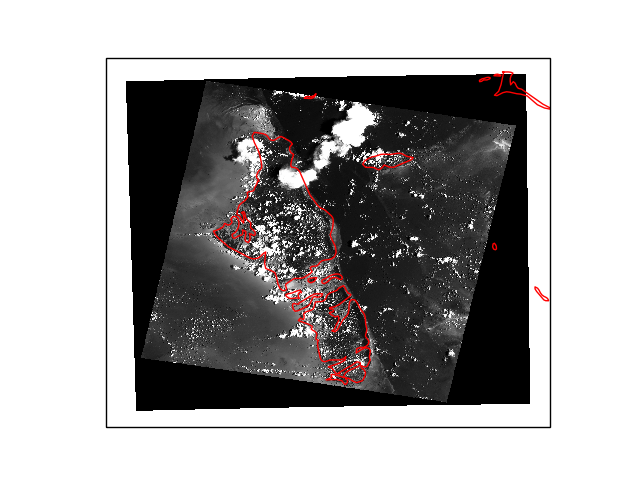
Parsing rasterio’s geocoordinates
Converting a projection’s cartesian coordinates into 2D longitudes and latitudes.
These new coordinates might be handy for plotting and indexing, but it should be kept in mind that a grid which is regular in projection coordinates will likely be irregular in lon/lat. It is often recommended to work in the data’s original map projection (see imshow() and map projections).
import cartopy.crs as ccrs
import matplotlib.pyplot as plt
import numpy as np
from rasterio.warp import transform

import xarray as xr

# Read the data
url = "https://github.com/mapbox/rasterio/raw/master/tests/data/RGB.byte.tif"
da = xr.open_rasterio(url)

# Compute the lon/lat coordinates with rasterio.warp.transform
ny, nx = len(da["y"]), len(da["x"])
x, y = np.meshgrid(da["x"], da["y"])

# Rasterio works with 1D arrays
lon, lat = transform(da.crs, {"init": "EPSG:4326"}, x.flatten(), y.flatten())
lon = np.asarray(lon).reshape((ny, nx))
lat = np.asarray(lat).reshape((ny, nx))
da.coords["lon"] = (("y", "x"), lon)
da.coords["lat"] = (("y", "x"), lat)

# Compute a greyscale out of the rgb image
greyscale = da.mean(dim="band")

# Plot on a map
ax = plt.subplot(projection=ccrs.PlateCarree())
greyscale.plot(
    ax=ax,
    x="lon",
    y="lat",
    transform=ccrs.PlateCarree(),
    cmap="Greys_r",
    add_colorbar=False,
)
ax.coastlines("10m", color="r")
plt.show()
Total running time of the script: ( 0 minutes 1.483 seconds)