Note
Click here to download the full example code
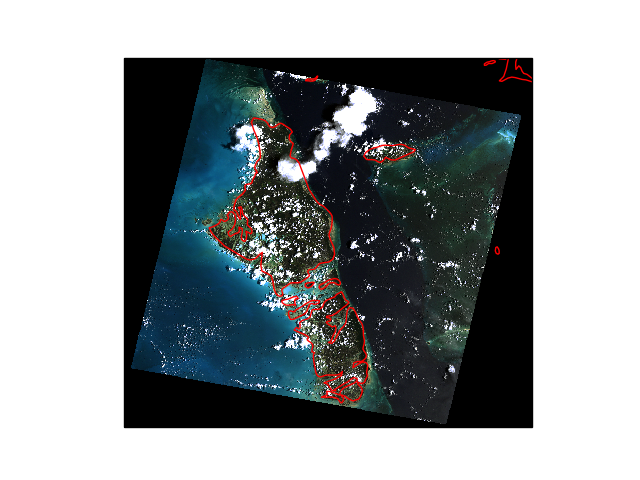
imshow() and map projections
Using rasterio’s projection information for more accurate plots.
This example extends Parsing rasterio’s geocoordinates and plots the image in the original map projection instead of relying on pcolormesh and a map transformation.
import cartopy.crs as ccrs
import matplotlib.pyplot as plt

import xarray as xr

# Read the data
url = 'https://github.com/mapbox/rasterio/raw/master/tests/data/RGB.byte.tif'
da = xr.open_rasterio(url)

# The data is in UTM projection. We have to set it manually until
# https://github.com/SciTools/cartopy/issues/813 is implemented
crs = ccrs.UTM('18N')

# Plot on a map
ax = plt.subplot(projection=crs)
da.plot.imshow(ax=ax, rgb='band', transform=crs)
ax.coastlines('10m', color='r')
plt.show()
Total running time of the script: ( 0 minutes 2.790 seconds)