Examples
Shared setup:
import xray
import numpy as np
import pandas as pd
np.random.seed(123)
def make_example_data():
times = pd.date_range('2000-01-01', '2001-12-31', name='time')
annual_cycle = np.sin(2 * np.pi * (times.dayofyear / 365.25 - 0.28))
base = 10 + 15 * annual_cycle.reshape(-1, 1)
tmin_values = base + 5 * np.random.randn(annual_cycle.size, 10)
tmax_values = base + 10 + 5 * np.random.randn(annual_cycle.size, 10)
ds = xray.Dataset({'tmin': (('time', 'x'), tmin_values),
'tmax': (('time', 'x'), tmax_values),
'time': ('time', times)})
return ds
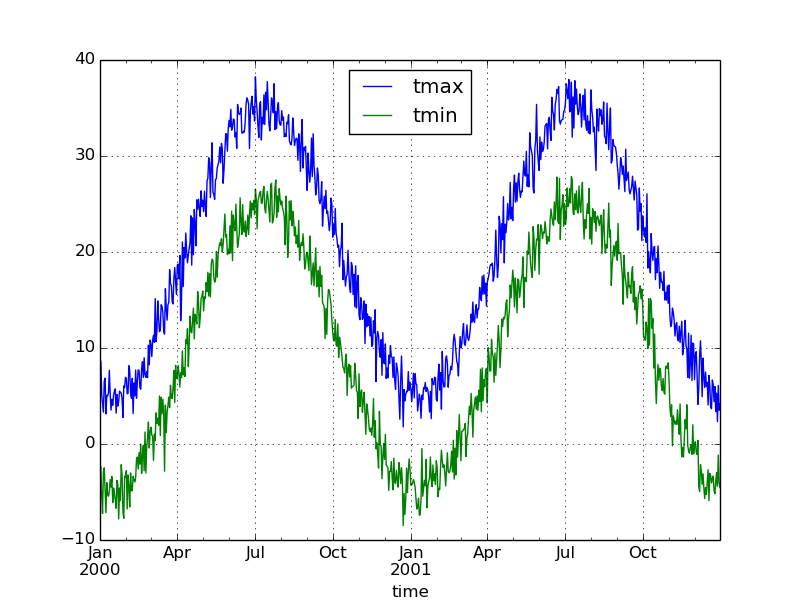
ds = make_example_data()
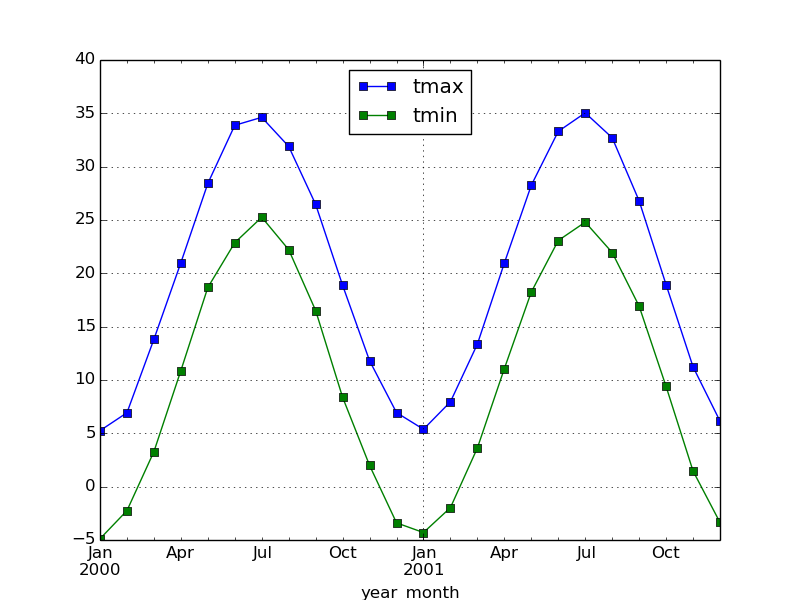
Monthly averaging
def year_month(xray_obj):
    """Given an xray object with a 'time' coordinate, return an DataArray
    with values given by the first date of the month in which each time
    falls.
    """
    time = xray_obj.coords['time']
    values = pd.Index(time).to_period('M').to_timestamp()
    return xray.DataArray(values, [time], name='year_month')

ds.mean('x').to_dataframe().plot()

monthly_avg = ds.groupby(year_month(ds)).mean('time')
monthly_avg.mean('x').to_dataframe().plot(style='s-')
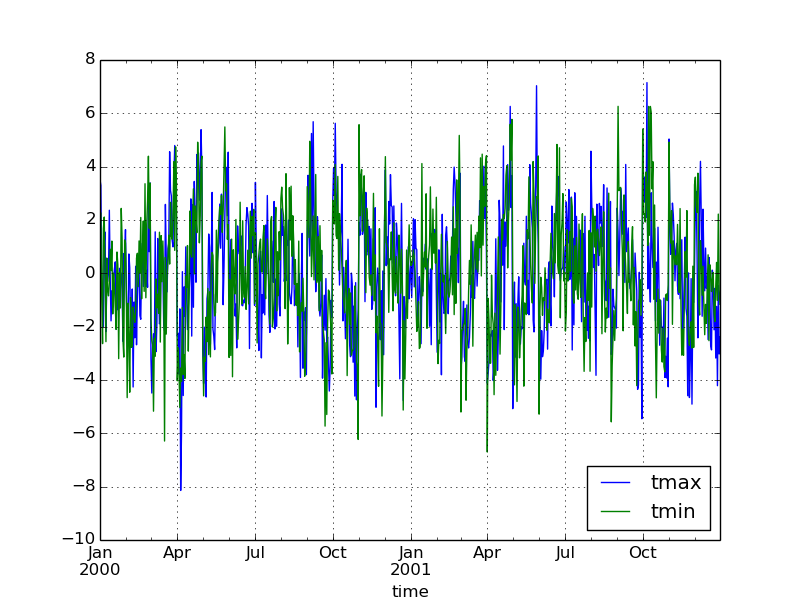
Calculate monthly anomalies
def unique_item(items):
    """Return the single unique element of an iterable, or raise an error
    """
    items = set(items)
    assert len(items) == 1
    return items.pop()

def _anomaly_one_month(ds):
    month = unique_item(ds['time.month'].values)
    rel_clim = climatology.sel(**{'time.month': month})
    return ds.apply(lambda x: x - rel_clim[x.name])

climatology = ds.groupby('time.month').mean('time')
anomalies = ds.groupby('time.month').apply(_anomaly_one_month)
# in a future verson of xray, this should be as easy as:
# anomalies = ds.groupby('time.month') - climatology

anomalies.mean('x').drop_vars('time.month').to_dataframe().plot()