Note
Click here to download the full example code
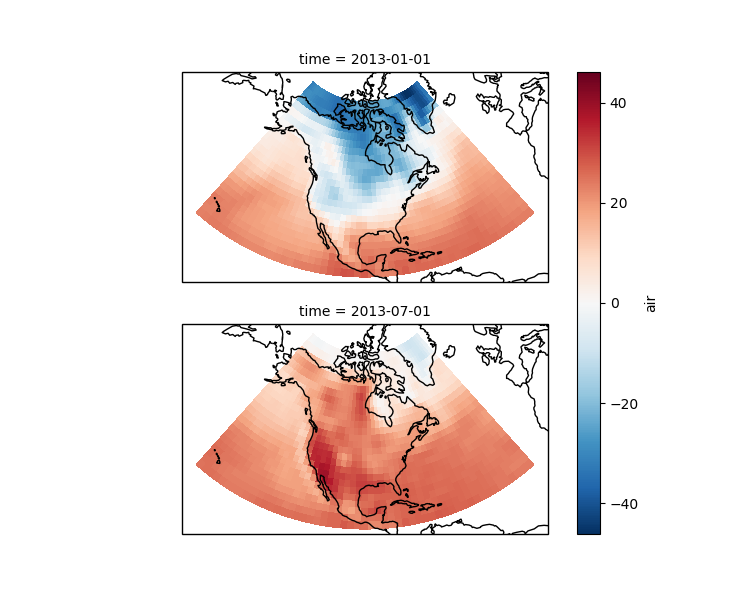
Multiple plots and map projections
Control the map projection parameters on multiple axes
This example illustrates how to plot multiple maps and control their extent and aspect ratio.
For more details see this discussion on github.
from __future__ import division

import cartopy.crs as ccrs
import matplotlib.pyplot as plt

import xarray as xr

# Load the data
ds = xr.tutorial.load_dataset('air_temperature')
air = ds.air.isel(time=[0, 724]) - 273.15

# This is the map projection we want to plot *onto*
map_proj = ccrs.LambertConformal(central_longitude=-95, central_latitude=45)

p = air.plot(transform=ccrs.PlateCarree(),  # the data's projection
             col='time', col_wrap=1,  # multiplot settings
             aspect=ds.dims['lon'] / ds.dims['lat'],  # for a sensible figsize
             subplot_kws={'projection': map_proj})  # the plot's projection

# We have to set the map's options on all four axes
for ax in p.axes.flat:
    ax.coastlines()
    ax.set_extent([-160, -30, 5, 75])
    # Without this aspect attributes the maps will look chaotic and the
    # "extent" attribute above will be ignored
    ax.set_aspect('equal', 'box-forced')

plt.show()
Total running time of the script: ( 0 minutes 0.119 seconds)